De aardbodem en zeebodem beweegt wel en/of aardplaten verschuifen soms zelfs over mekaar, sommige landsdelen gaan omhoog anderen dalen,
idd, maar de algemene trend is een vermindering van waterdiepte met 30 to 50 cm over de laatste 20 jr
nogmaals, dit is niet het resultaat van wetenschappelijk onderzoek, maar een pure praktische vaststelling aan de hand van zeekaarten
Heb ge daar ergens een referte van ? Van waterdiepte, hoe wordt dat gemeten, wslk enkel Sonar ?
http://www.mos.org/oceans/planet/features.htmlhttp://nl.wikipedia.org/wiki/Bathymetriehttp://en.wikipedia.org/wiki/BathymetryDe zeebodem kan zakken of stijgen (ook vulkanen), aardplaten gaan uiteen, schuiven overeen, bergen worden hoger, stromingen slib ... zand, enz....
En waarop baseren dan die (recente) zeekaarten ?
Satellietmetingen gebruiken ze om de water
hoogte tov een vast punt te bepalen, waterdiepte is wslk wat anders, daar spelen andere factoren ook een rol.
20 jaar geleden waren de metingen wel op een andere manier als nu - oude satellieten, andere computerberekingen -
, mss vandaar die verschillen ? Simpel is het zeker niet...
Hier al "serieuze" correcties van de NASA:
 http://earthobservatory.nasa.gov/Features/OceanCooling/page3.php
Even googlen op "ocean levels":
hier (citaat) spreken ze van omgerekend
5 cm stijging op 20 jaar -water
hoogte - ochottekes, op basis vanaf 2003.
ook:
http://en.wikipedia.org/wiki/Sea_level_riseEuropese:
http://www.eseas.org/products/?page=real_time_datahttp://www.eseas.org/products/?page=eda/map site is nog niet klaar.
Hier een
snapshot van de NASA:

http://arstechnica.com/science/news/2009/03/scientists-track-the-oceans-rise-as-the-globe-warms.ars
Throughout the planet's history, ocean levels and temperatures have had a fairly straightforward relationship: when the earth cools down, ocean levels drop; when it heats up, they rise. The basics of this dynamic are pretty simple. When the climate is warm, land-based ice melts, and much of that water winds up in the oceans. The water in the oceans also occupies more volume, since water expands when it heats up. Cooling the climate reverses both of these processes.
Consistent with the rise registered in global temperatures, various measurements have shown that the oceans have been rising for at least the last century. Yet the steady rise that has been observed covers a fairly complex system, with seasonal variability and changes in the relative contributions of different factors. If we're to provide accurate forecasts of how the ocean levels might respond to further changes in the climate, it will be essential that we understand this complexity. A panel at February's meeting of the American Association for the Advancement of Science tried to tackle the issue.
What we know, and how we know it
The longest continual record of ocean levels comes from tide gauges. Unfortunately, these instruments produce very noisy data and, at earlier time points, were very sparsely distributed. In recent years, they've been supplemented by satellite measurements of ocean levels. The most significant is the Topex-Jason series, which dates back to 1983. That's the longest continuous satellite record but, at different points, a variety of other satellites have also provided measures of the altitude of the surface of the ocean. According to the speakers on the panel, all of these measures of sea level rise line up within the margins of instrument error, so they felt pretty confident in the basics.
Those basics show an accelerating sea level rise. Anny Cazenave, who chaired the session, noted that the average change over the years from 1950 to 2000 was about 1.8mm per year. Over the last 16 years, however, she said the average was 3mm a year.
In recent years, we've supplemented the basic measure of sea level with a variety of instruments that get at the underlying contributors. For example, the GRACE satellite system can measure that gravitational attraction of both ice sheets and the oceans they feed into, which produces estimates of mass changes. A series of floats—XBT, MBT, and Argo—have measured temperature and salinity down to a few thousand feet, although the record from these devices is a bit sparse.
With the basic sources of data described, Cazenave explained how these new instruments have changed our view of the generally smooth rise of the oceans. Prior to 2003, she said, about half of the annual change was contributed by thermal expansion of the oceans; since 2003, however, the surface temperatures of the oceans have stabilized, and thermal expansion has ground to a halt. That might be expected to halve the rate of sea level rise, but it hasn't. Instead, increases in the contributions from melting glaciers seem to have partially made up for the change, keeping the rise in the neighborhood of 2.5mm a year.
These results have told us that the underlying causes of sea level rises may change rapidly and be out of sync with each other. It's useful information, but it makes providing accurate predictions of future change that much harder. After delivering that message, Cazenave handed the podium over to a series of speakers that tackled the different contributors.
Thermal expansion: NOAA's Sydney Levitus described the use of ship-based instruments and floats to reconstruct the rise in sea levels that can be attributed to warming of the water itself. Two series of ship-based instruments, XBT and MBT, are now recognized to have suffered from some form of systemic instrument error, although Levitus didn't describe the precise problems in detail. Although this throws off the absolute numbers, the trends should still be trustworthy, and those show an acceleration of thermal expansion up until recent years. A number of groups have tried to correct for the errors, and the numbers seem to be converging on something in the range of .4-.6mm/year as the average since 1965, a figure that's consistent with the one generated by coupled ocean/climate models that include greenhouse forcings.
We hebben ochottekes wat te verwaarlozen-extra-CO2 en andere gassen de lucht in geblazen, en dat eigenlijk maar een 100 jaar lang op vele duizenden jaren, en binnen xx-jaar zal het heel wat minder zijn (fossiele brandstoffen zullen wel opgeraken);
wie weet mogen we binnen xx-jaren blij zijn dat we dat gedaan hebben, en daardoor de nieuwe ijstijd wat vertraagd...
Door koude zullen altijd veel meer doden vallen als door warmte, men hoeft maar te googlen hoeveel arme mensen zich letterlijk doodvriezen...
In de 70-er jaren, weet ik nog, hadden de "wetenschappers" ook een -wel veel mindere- "consensus" (de media was nog niet zo zot), dat
de ijstijd al ingezet had, 20 jaar later was het al "Global Warming Consensus"...
http://en.wikipedia.org/wiki/Global_cooling
1972 and 1974 National Science Board
The National Science Board's Patterns and Perspectives in Environmental Science report of 1972 discussed the cyclical behavior of climate, and the understanding at the time that the planet was entering a phase of cooling after a warm period. "Judging from the record of the past interglacial ages, the present time of high temperatures should be drawing to an end, to be followed by a long period of considerably colder temperatures leading into the next glacial age some 20,000 years from now."[17] But it also continued; "However, it is possible, or even likely, that human interference has already altered the environment so much that the climatic pattern of the near future will follow a different path."[17]
The Board's report of 1974, Science And The Challenges Ahead , continued on this theme. "During the last 20-30 years, world temperature has fallen, irregularly at first but more sharply over the last decade."[18]
Waar waren we..aja
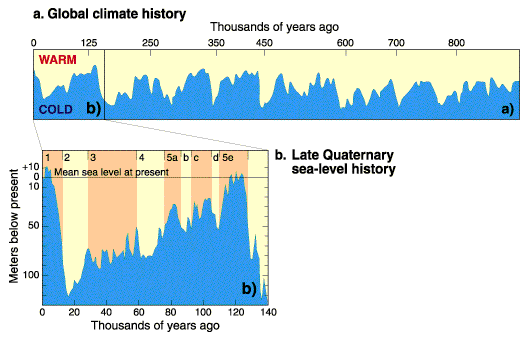
Soit, grafiekskes van vroegere waterhoogte-tijden: gaan we ons daar nu echt druk over maken ?

Is ongeveer hetzelfde als die G
WClimate -grafieken, denk de mens nu echt dat ze de natuur - zelfs marginaal - kunnen beïnvloeden ?
Sea-level changes and relative temperatures

http://en.wikipedia.org/wiki/Sea_level
Waterhoogtes in tientallen meters hé...
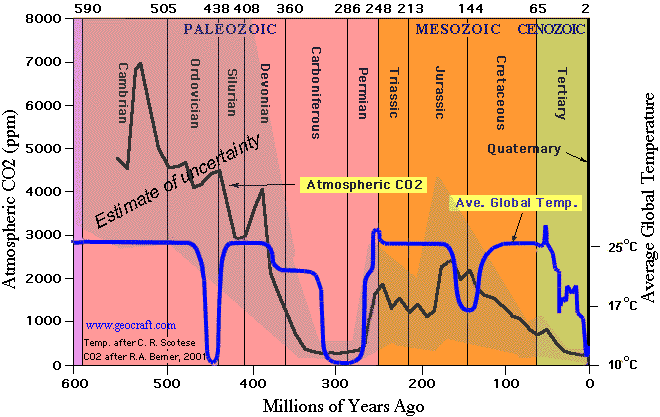
CO2-temperatuur relatie in miljoenen jaren, waar zijn de global temp van 22° C gebleven ?

We hebben nu 380 ppm CO2... 1000 ppm is ideaal voor plantengroei...


Oef, weer zo´n lange post...
